
Charting KU’s Defensive Trajectory
Anyone who knows me knows that I like a suffocating defense more than a high powered offense any day of the week. So I have been somewhat dissapointed with the defensive effort I have seen thus far from a team that could be so much better. At times it looks like they haven’t bought in to the defensive concepts all the way. It could also be that team defense is a learned skill and the Jayhawks have a lot of learning left to do,
I thought I would take a moment to dive into the defensive progress of this team by comparing a few different statistics in the context of the competition played. I also wanted to try to track the improvement (if it exists) over the course of the non-conference schedule before we move into conference play.
Here is the raw data looking at the Jayhawks’ opponents’ RPI and the effective FG% that team produced against the Kansas defense. It also includes some indexes I will explain later.
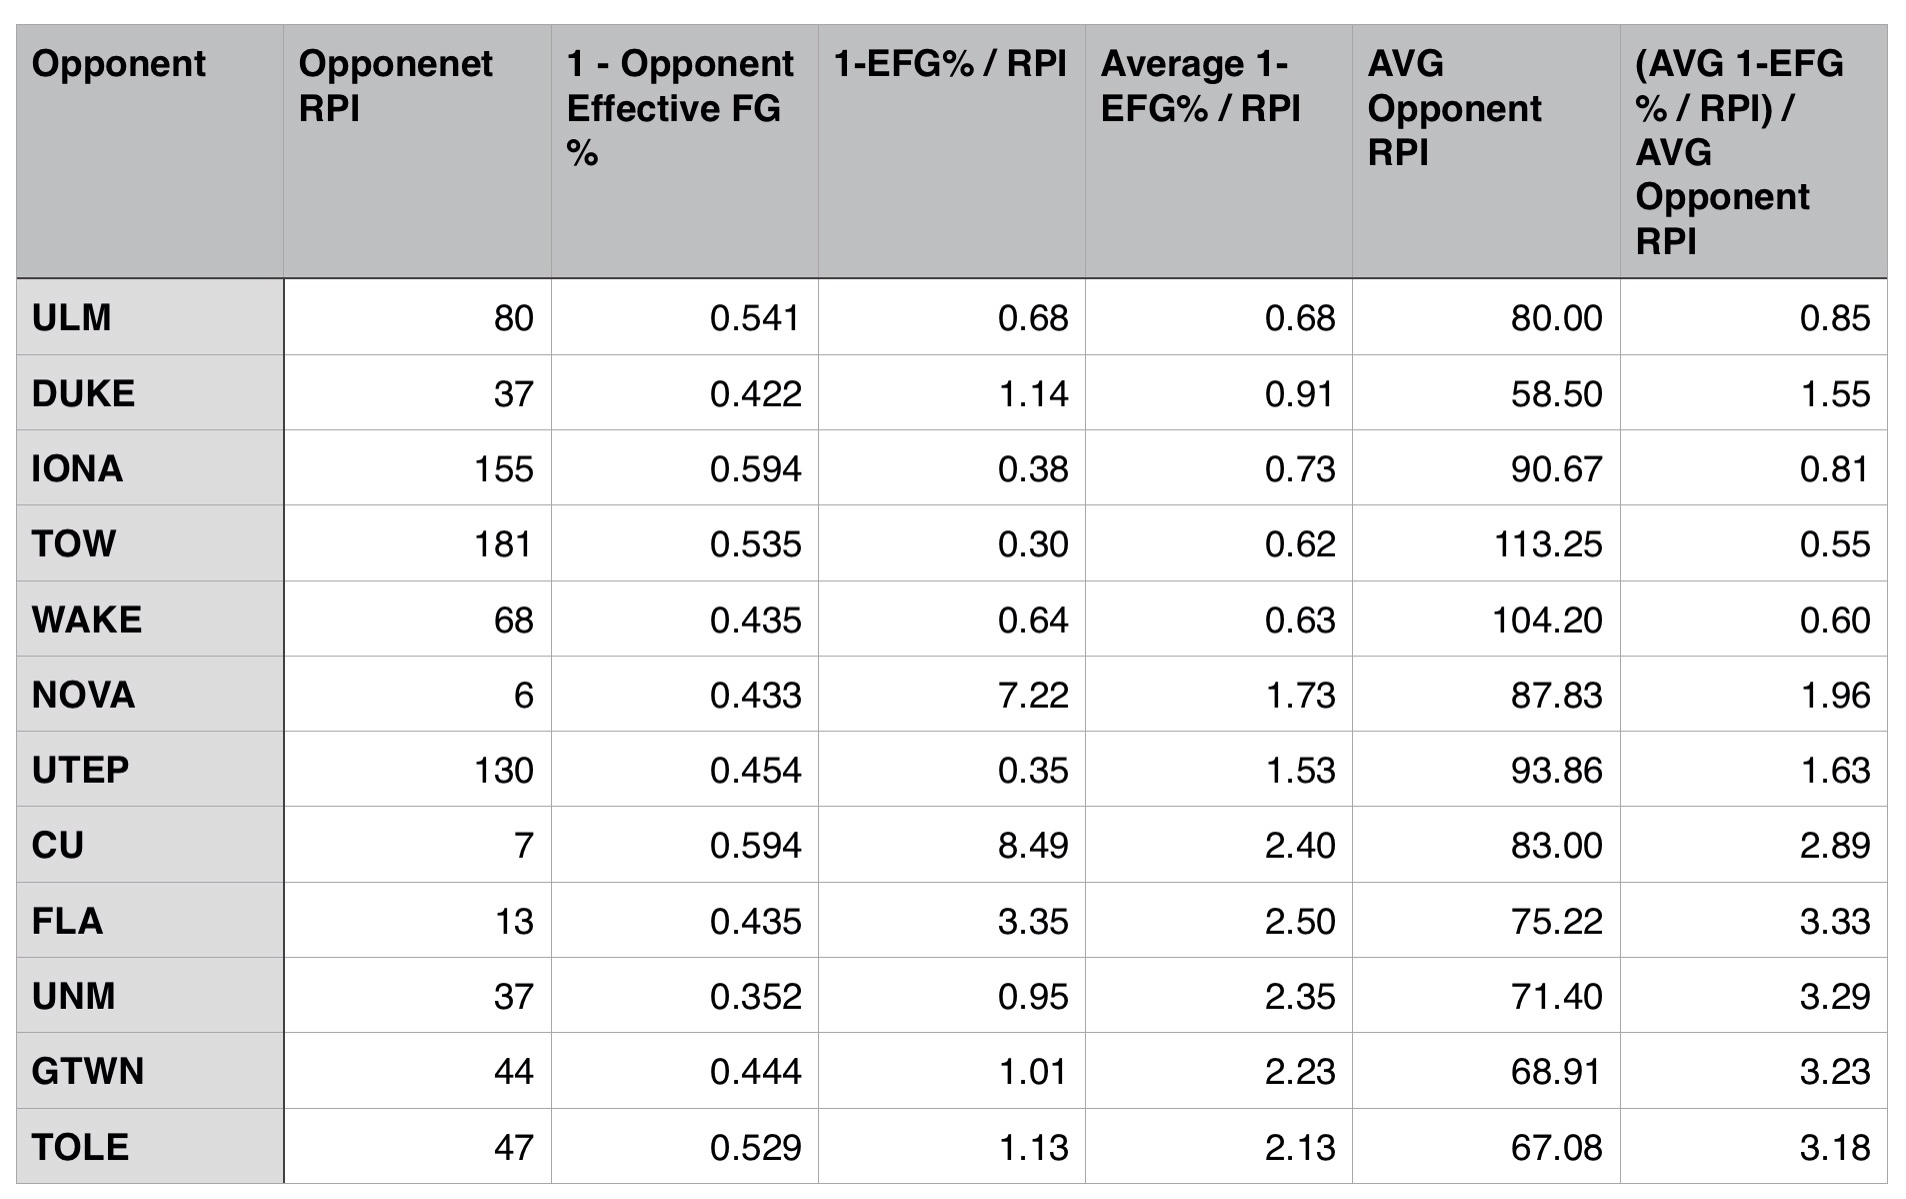
The main index I created on this table is the “1-EGF% / RPI” number. What this attempts to do is to set up a ratio that produces a higher number for both a lower effective field goal percentage allowed (better defense) and a lower RPI opponent (better opponent).
For example, if we played the 10th RPI ranked team and gave up a 35% EFG% that ratio would produce an output of 6.5. If the team played improves by 1 spot to 9, the result is 7.2. If the EFG% improves by 1% to 34% but the RPI stays the same, the result improves to 6.6. As you can see this places more emphasis on the quality of the opponent over the raw percentages. I think this is fair because of the schdule KU has played and because, as we saw against SDSU, shooting is offensive efficiency is more volatile than quality of opponent.
We will call this result our “defensive index” (DI). So how does it track over the course of the season?
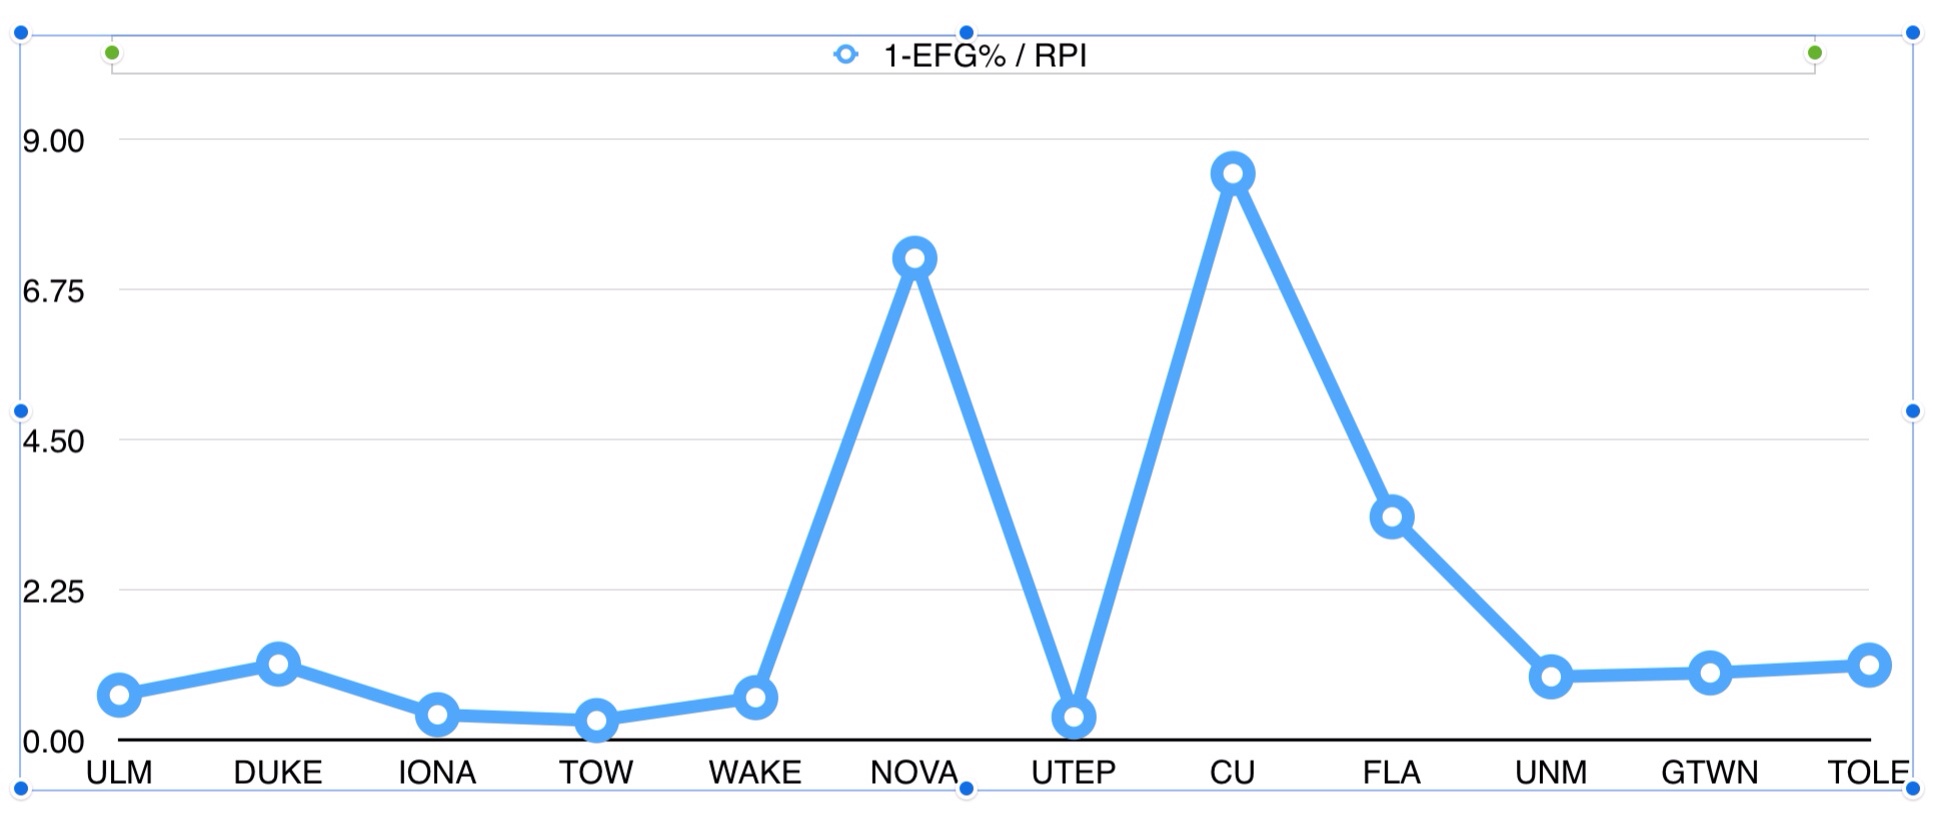
As you can see it is hard to tell from this view given some major fluctuations. If you eliminate some of the highest RPI opponents in NOVA, CU and FLA, there appears to be some kind of slight steady imprrovment.
Now, finally, let’s take alook at the aggregate of these data. What happens when we take the cumulative average DI after each game and compare it to the cumulative average RPI of the opponents played? This should eliminate some variablity over the season while still showing defensive improvement in the context of the schedule played as the season has progressed.
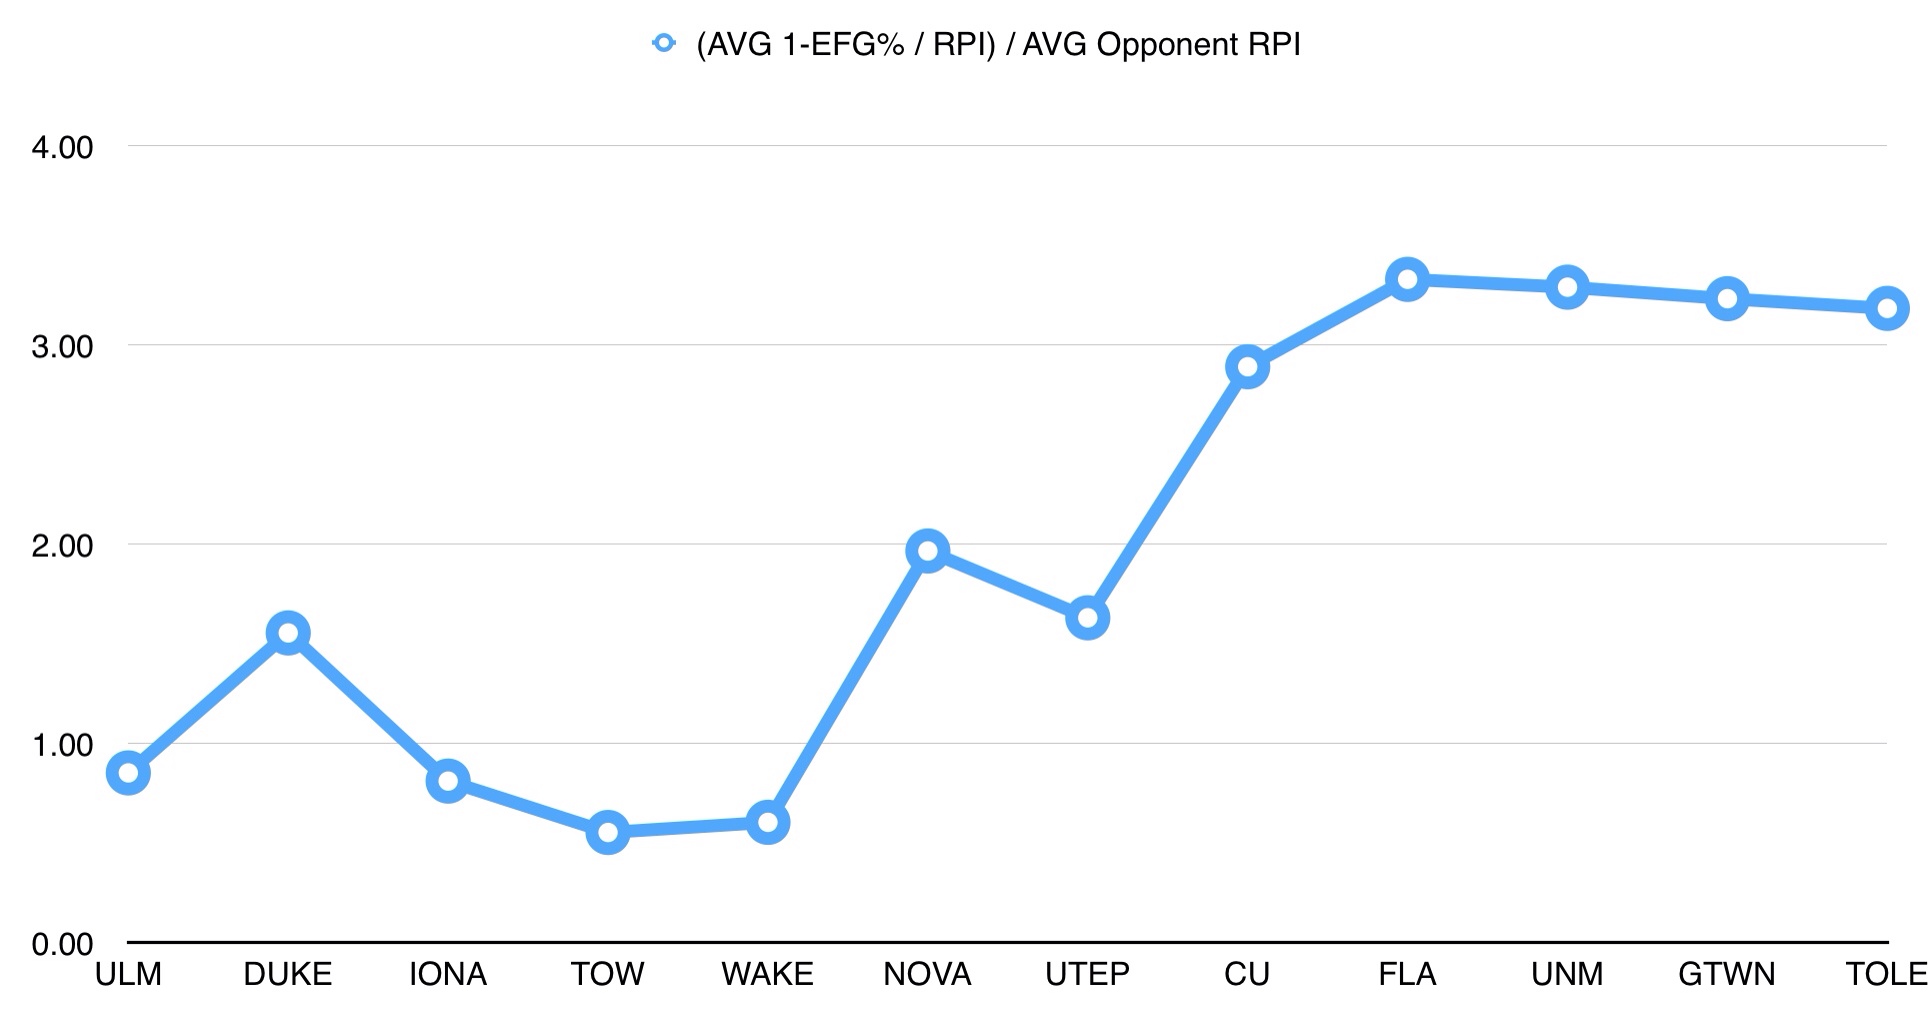
Now we see a nice upward trend which has recently tapered and is perhaps on a mild decline. I think most KU fans could have come up with this trend on intuition alone, but it is always nice to have some data behind it.
What we know is that KU’s defense is imporoved over the year given the context of the schedule, but that the last 3 games have not shown any signs of forward progress. This is despite the usual improvement over the holiday break for a Self-coached team? The Jayhawks will need to get that line ticking upwards again in the coming stretch to have a hope for their 10th straight Big 12 title.